
Kapil Dave
"Master's Graduate in Data Analytics"
About Me
Hi, I am Kapil Dave. I am highly analytical and have recently completed my Master's Degree in Data Analytics with a Distinction achieving 74%, along with online courses through Udemy to learn Power BI, Excel and SQL. I have used tools such as SQL, Python, SAS, Excel, SPSS and Power BI to help solve real-world problems through the power of Data Analysis within my academia, personal side projects, freelance projects and job simulations replicating the role of a Data Analyst for major companies such as Accenture and PwC.
Skills

Power BI | Excel | SQL | Python |SAS | SPSS
Programming & Tools: Python, SQL, Excel, SAS, SPSS, Power BI
Data Analysis & Modelling: Statistical Analysis, Data Cleaning, Data Modelling, Data Analysis
Data Visualization: Data Visualization (Power BI, Excel)
Machine Learning
Communication
Teamwork
Interpersonal skills
Organisation skills
Time-management
Attention to detail
Featured Projects
Python | SQL
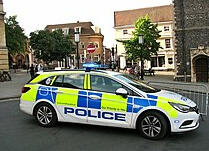
Crime analysis in Leicestershire and City Of London
Carried out queries and visualisation using PySpark and Matplotlib to analyse crime in Leicestershire and City Of London.

Excel
Coffee shop sales in New York
Used Pivot charts and Pivot tables to identify key trends and make data driven decisions for a fictitious coffee shop in New York.
Power BI | Toy Store KPI Report
Built an interactive report to identify key trends and insights for a fictitious chain of toy stores in Mexico.

Python | SQL | Power BI
Comparative analysis of the 2011 and 2023 ODI World Cup
Compared performance metric's in the 2011 and 2023 ODI World Cup with Hypothesis Testing and visualised my findings using Power BI desktop.

SQL | Excel
New Zealand Motor Vehicle Thefts
Ran relevant SQL queries to identify key trends in Motor vehicle theft in New Zealand and visualised the findings using Excel.

Excel
Defect analysis and visualisation for high-precision manufacturing parts
Utilized pivot tables and pivot charts to create dynamic and interactive visualizations for monitoring and reporting defect patterns in manufacturing parts.
Python/SQL
Crime analysis in the City of London and Leicestershire